
Measure the difference.
Real operations. Real data. Real technology.
- Tons of cargo moved every year
- 1 Lakh+
- Cargo value managed annually
- USD 1B+
- Businesses served since 2020
- 500+
- Cities, with 30+ satellite offices
- 20+
- Vehicles placed for customers since 2020
- 50,000+
- Global GPS provider integrations
- 100+
- Truck tracking and cargo vessel visibility
- 24×7
- Combined forwarding & supply-chain experience
- 50+ yrs
Headline outcomes
What moves first.
- FasterException detection and operational response
- FewerManual touchpoints across planning, execution, tracking and closure
- FasterPOD closure, invoicing and settlement cycles
- LowerDetention and demurrage exposure at ports and yards
- HigherCarrier compliance and qualification coverage
- LowerCoordination cost across carriers, systems and teams
* Indicative. Actual performance varies by customer, operating model and scope. Customer-specific baselines and improvement targets are established during implementation.
The KPI framework
Thirteen measures, agreed against your baseline.
- KPI 0150%+*
Lower customer effort
Reduce calls, emails, follow-ups and manual coordination through digital workflows and unified visibility.
- KPI 0224×7
Shipment visibility
Continuous visibility of every shipment, end to end.
- Trucks
- Containers
- Cargo / vessels
- KPI 03
Qualification coverage
Digital qualification workflows before any vehicle or carrier enters the network.
- Vehicles
- Drivers
- Carriers
- KPI 04
Faster exception response
AI and digital monitoring identify exceptions earlier and enable faster operational intervention.
- KPI 05
Reduced manual touchpoints
Automation removes repetitive activity across the transport lifecycle.
- Planning
- Execution
- Tracking
- POD
- Closure
- KPI 06
Higher on-time delivery
Monitor and improve delivery performance, transit adherence and ETA accuracy.
- KPI 07
Lower empty and idle time
Better planning and visibility improve asset utilisation.
- KPI 08
Lower detention & demurrage exposure
Earlier visibility into container and port movement helps avoid preventable delays.
- KPI 09
Faster POD closure
Shorten the time between delivery completion and POD closure.
- KPI 10
Faster invoice & settlement cycle
Digital POD and workflow controls accelerate downstream financial processes.
- KPI 11
Lower coordination cost
Less effort spent coordinating multiple carriers, tracking systems and operational teams.
- KPI 12
Higher carrier compliance
Continuous monitoring of carrier qualification, documentation and operational performance.
- KPI 13
Lower exception rate
Operational data surfaces recurring issues so processes improve over time.
* Indicative. Actual performance varies by customer, operating model and scope. Customer-specific baselines and improvement targets are established during implementation.
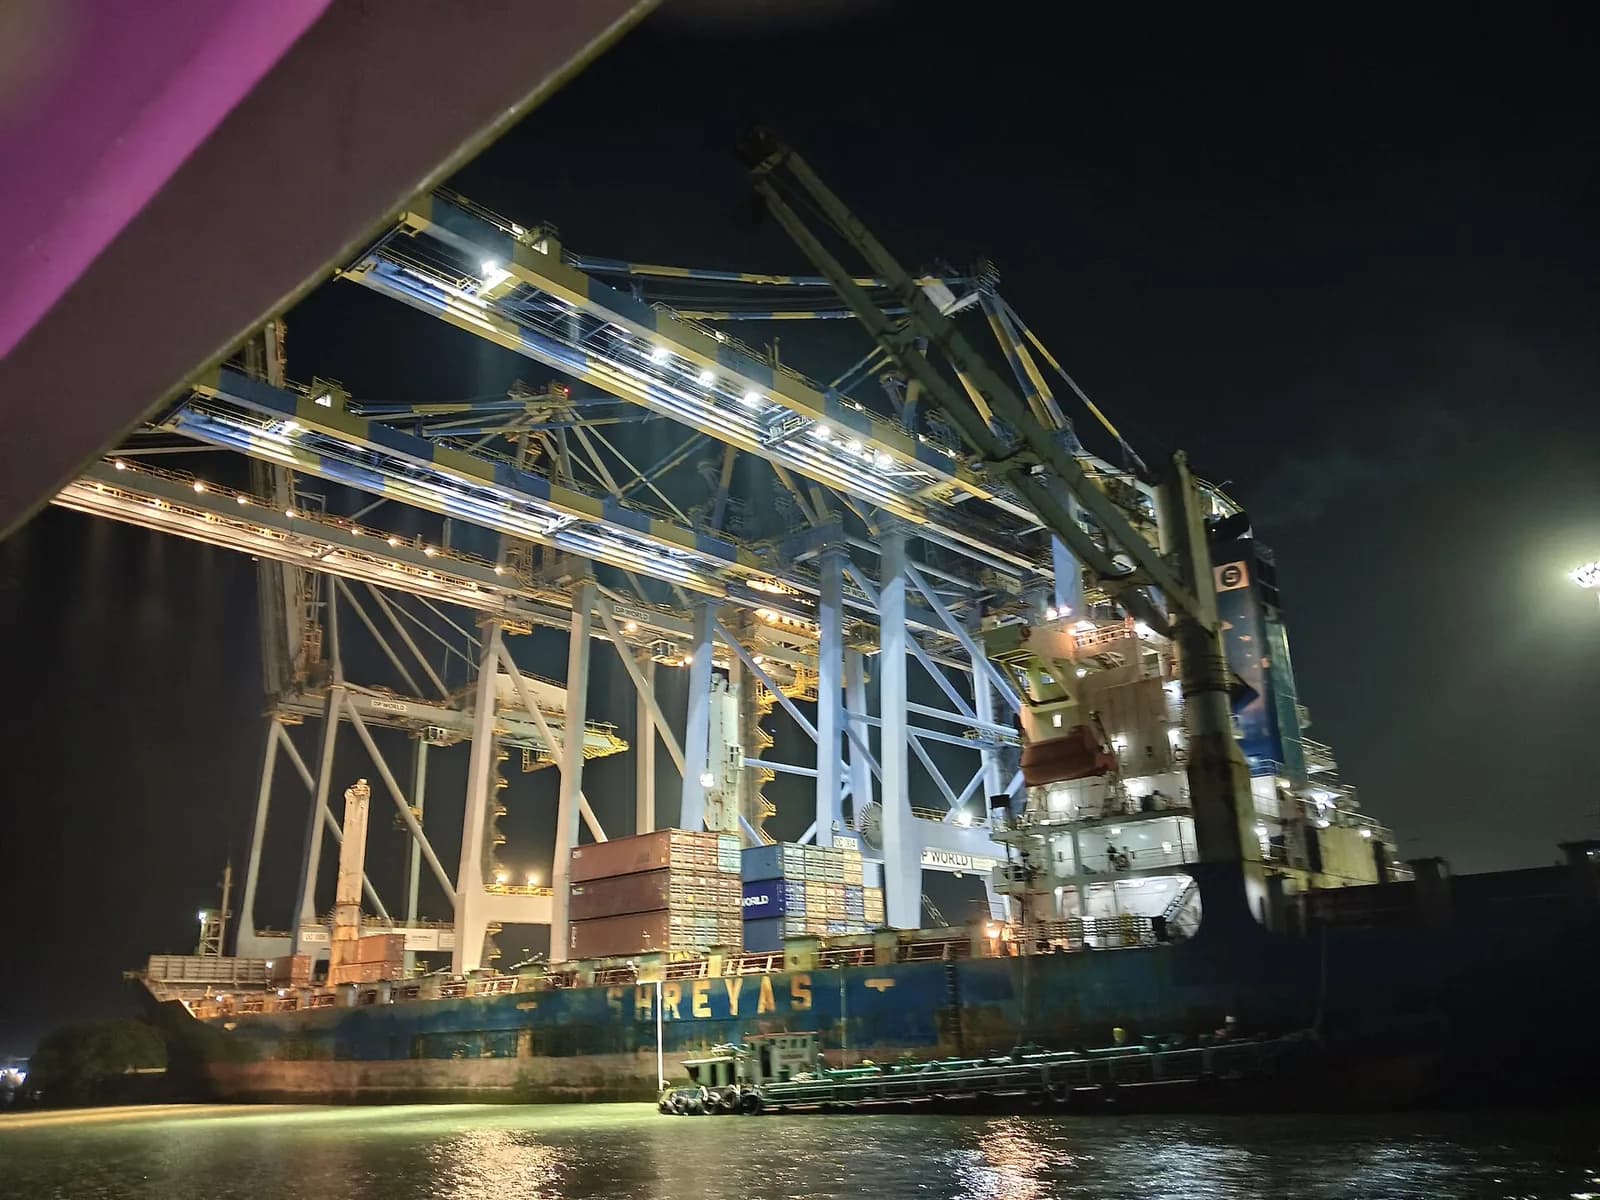 Photo: BgbwikiV4, CC BY 4.0
Scale built through experience
Technology shaped by the realities of moving cargo.
What changes when you work with Wheelson?
Before Wheelson
- Multiple vendors and tracking systems
- Follow-ups on calls and chat groups
- Fragmented data, reactive operations
- Manual qualification
- Control depends on individuals
With Wheelson
- One extended supply chain team
- Unified visibility on moWe, 24×7
- Exceptions flagged before they become delays
- Carriers, vehicles and drivers qualified by agents
- Performance measured against agreed KPIs
Start with the problem
Have a supply chain problem? Start there.
Tell us the problem, not the rate card. We'll come back with the right mix of operations, technology and governance within one working day.